Research Goals
How do your efforts make kestrel research and conservation possible at continental scales?
Here is one example illustrating how your nestbox data, whether from one box or 100, can help researchers understand how land management can benefit nesting kestrels. This map of south Boise, Idaho, has blue icons representing kestrel nestboxes around The Peregrine Fund’s property, which is largely grassland and sagebrush, and orange icons representing nestboxes in areas with mostly suburban and agricultural development.

Example questions:
1) Which group of nestboxes would have a higher % of occupancy by breeding kestrels? Perhaps the blue group, because kestrels might perceive rural areas as higher quality habitat. Alternatively, the orange group might have higher occupancy because kestrels might hone in on the high densities of small rodent prey in developed areas.
2) If the density of small rodents is higher in developed areas, then is nestling survival also greater because of abundant food? Or is nestling survival diminished because of exposure to rodenticides or disease?
These are just a few hypothetical questions, of many, and we don’t know the answers — with your help, we can develop a better understanding of kestrel ecology and enjoy the striking color and fiesty personality of North America’s smallest falcon for many generations to come.
More detail:
The American Kestrel Partnership is developing and coordinating a network of locally managed nestbox monitoring programs across North and South America to generate kestrel nesting data at unprecedented spatial scales, including data on phenology (seasonal timing of nest initiation), occupancy (% of nestboxes occupied by kestrels), productivity (number of nestlings in the nest), and survival (number of nestlings fledged from the nest). These important measures of nesting performance are then related to environmental factors, such as land use/landscape composition, climate variation, soil condition, and environmental contaminants. Understanding these relationships will paint a more complete picture of the American Kestrel’s life history and provide information to support conservation of kestrel habitat and populations.
Full Cycle Phenology & American Kestrel Genoscape Projects
The Full Cycle Phenology Project brings together a group of diverse and uniquely qualified collaborators from Boise State University, the American Kestrel Partnership, HawkWatch International, St. Mary’s University, Environmental Laboratory of the U.S. Army Engineer Research and Development Center, and the University of California, Los Angeles. This project will combine cutting edge genetic techniques and a large-scale collaboration of professional and community scientists across the western hemisphere to find out more about migratory connectivity, population change, and the impacts of climate change on the American Kestrel and other migratory birds.
We are currently collecting feather samples across the breeding range of the American kestrel for genetic analysis (see Full Cycle Phenology website to get involved).
As part of the Full Cycle Phenology Project, the American Kestrel Partnership (AKP) is collaborating with Boise State University, UCLA, and Hawkwatch International to create the American Kestrel Genoscape Project. This page provides more details on the project, including preliminary results, and highlights the role of our partners in this project. Please read on to learn how to collect and submit samples this 2017 breeding season.
What is a 'Genoscape'?
You likely know that all individuals have slight variations in their genetic code. This also goes for populations within a species. Without getting too technical, populations are groups of individuals that interbreed or have the potential to interbreed. Therefore, individuals within a population have more similar genetic codes to each other than to individuals from other populations. By looking at the genetic codes across lots of individuals across space (be it a landscape, state, region, or even continent) we can determine where different populations exist. The map of these genetically distinct populations across geographical space, we call a genoscape (see example below).
Upon understanding a species' genoscape, we can then screen individuals to figure out which population they are from. This is the basis of UCLA's Bird Genoscape Project, which is looking at genetic samples of dozens of migratory bird species to understand where populations breed, migrate, and over-winter for each species. In the map below you see the genoscape and migration map for populations of the Wilson's Warbler from a study led by Kristen Ruegg at UCLA; this was the first map produced using this method and revolutionized how we will understand the migration patterns of avian species. We are using this technique for the American Kestrel Genoscape Project.
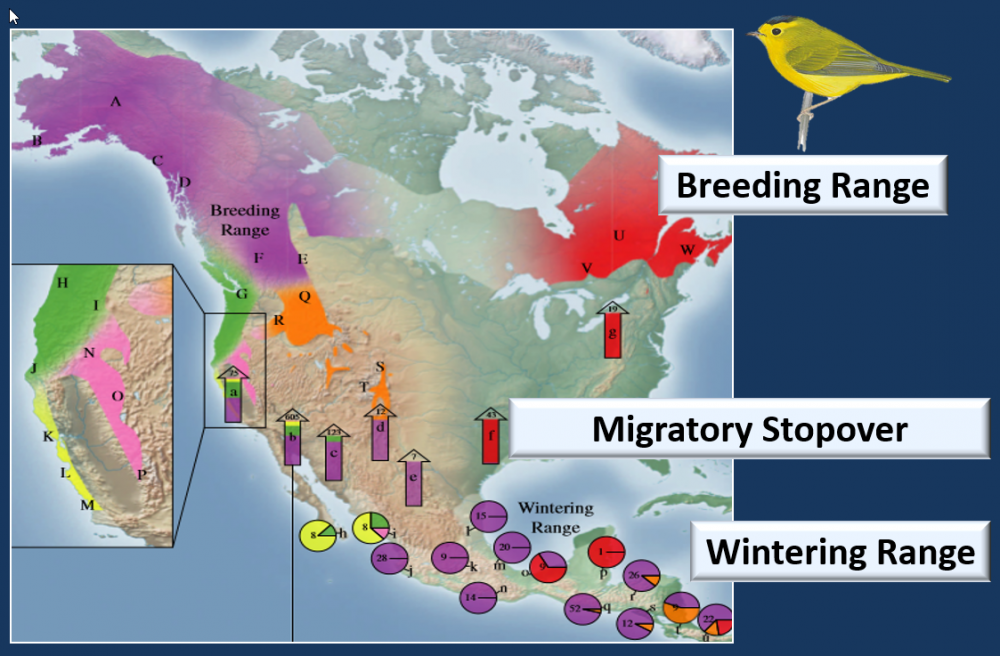
Led by Kristen Ruegg at UCLA, this study of Wilson’s Warbler (pictured) provides an excellent example of how we can study the migratory patterns of American Kestrel populations. Individuals were sampled on breeding grounds and six populations were identified (represented by different colors of amorphous color shading). Then, individuals were sampled at multiple migratory stopover locations (shown by the arrows) and at several location across the species' wintering grounds (shown by pie charts). These samples were screened to determine which breeding population they originated from, represented by the colors inside each arrow and pie chart. This method allows us to know where it is that breeding populations go for the winter and the route they follow when returning to their breeding grounds. For example, we see that the yellow population, winters on either side of the Gulf of California, migrates through the two westernmost stopover sites, and breeds on a portion of the California coast (figure modified from Ruegg et al. 2014).
How will this help us uncover causes of decline for the American Kestrel?
The American Kestrel Genoscape will allow us to “track” birds across all seasons. We can collect a feather from a migrating or wintering kestrel and figure out where that bird was born. By following kestrels across their full annual cycle, we can start to look for possible threats to kestrels in those locations since they spend so much of their life away from the breeding grounds. For example, we know that the most severe kestrel declines have taken place in the northeast US: according to the Breeding Bird Survey, American Kestrel breeding populations in the northeast US have declined by 88% since the 1960s! Are these birds facing major threats during migration or while over-wintering? The Genoscape project will get us much closer to answering this important question!
Where We Need Samples
To move forward we need to get more samples from across the breeding range to fill in many gaps, particularly in central North America. Check out the map to see where we really NEED samples! This is where YOU come in as an owner of a high priority nest box.

This map shows AKP partner nest box locations as of Spring 2017. High priority nest boxes (where we do not have samples) are shown in red, medium priority nest boxes (where we have a few samples) are shown in yellow, and low priority nest boxes (where we have a high number of samples) are shown in green. We welcome samples from all locations, but if you monitor one of these red nest boxes, WE NEED YOUR HELP!
I want to collect and send samples. What should I do?
We are seeking feather samples plucked from the breast of one American Kestrel nestling per nest during the 2017 breeding season. We do not want more than one nestling per nest to be sampled because we need unrelated individuals. Each sample should contain 2 feathers plucked from an individual (the 2nd feather is insurance against the 1st feather not providing sufficient DNA). The skin cells attached to the feather tip provide sufficient DNA for our method; therefore, feathers do not have to be blood feathers.
We will be happy to accept as few as one sample and up to about 25 samples from any given monitoring area. Feathers can be plucked with with your bare hand (don't need gloves) and stored in a coin envelope that we will send you. Samples should be kept at room temperature or in the refrigerator and shipped together to us at the end of the season. We will send you a pre-paid fed-ex label for free shipping. We need you to collect certain information, including nestling age and sampling date, and include this information on the sample envelope AND in a spreadsheet. You will need proper state and federal permits to collect feather samples.
We'll send you protocol details when you sign up. Please visit the Full Annual Cycle website to learn more about the American Kestrel Genoscape and to sign up if you want to contribute feathers for this project. (Signing up to contribute doesn't bind you to anything, but it helps us organize info from our contributors and potential contributors).
Further Information and Opportunities